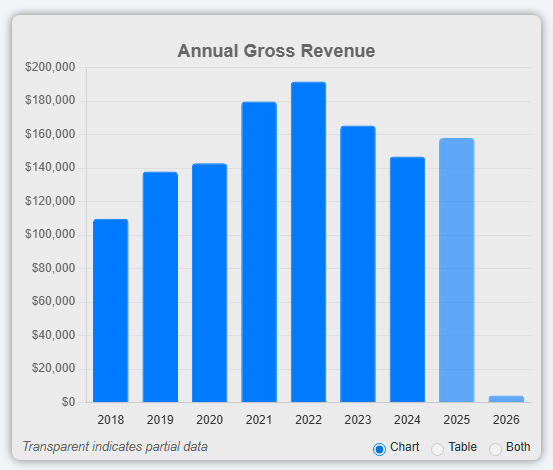
Shows gross revenue per year. Current and future years use a different color to indicate data is partial and may increase.
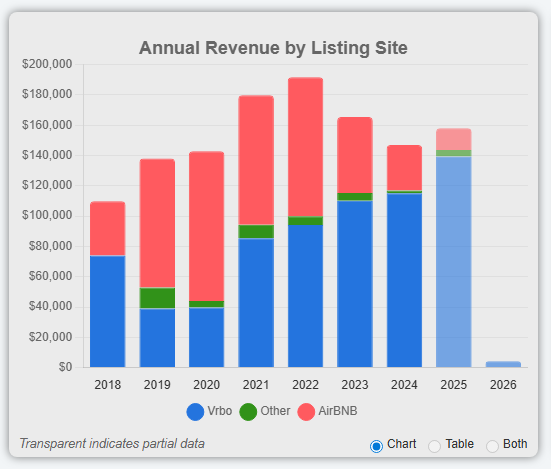
Shows the breakdown in income between different listing sites. Helps you understand where income comes from.
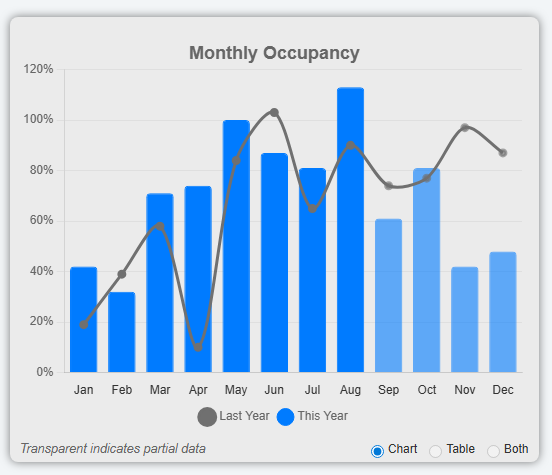
Occupancy per month helps you set appropriate rates to balance rates vs. occupancy
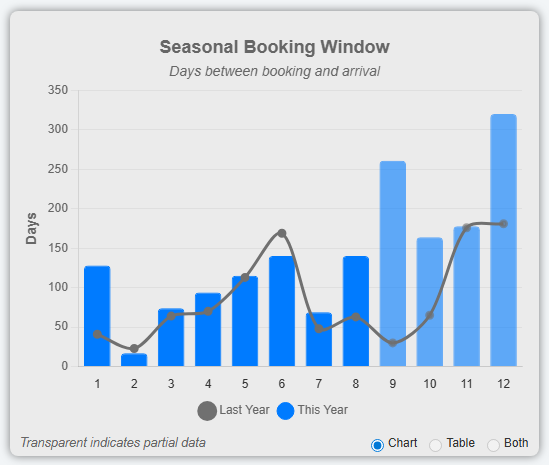
How many days do guests book in advance. Helps you set pricing based on demand, and know when to lower rates.
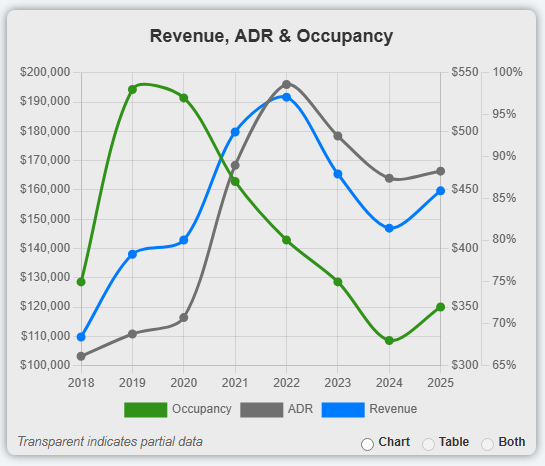
Illustrates the relationship between Revenue, ADR and Occupancy over time
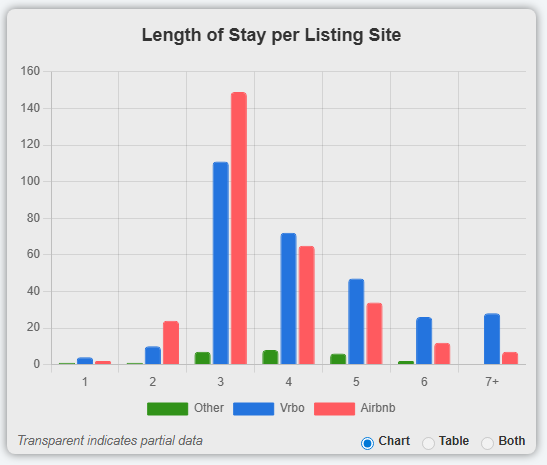
Shows how Length-Of-Stay differs between various Listing Sites